Back to News
News AlertWorld Money

U.S. Producer Prices Rise 6.5% Year Over Year; Truck Freight Jumps 3.9%

T
Author
Tushar Shrivas
Published
November 13, 2026
Reading Time
6 MIN READ
Spread the Word
U.S. Producer Prices Rise 6.5% Year Over Year; Truck Freight Jumps 3.9%
What Happened? US Producer Inflation Reached 6.5%

U.S. producer prices increased by 0.3% in October 2026, below the 0.4% monthly increase expected by economists polled by Reuters. The actual result was reported by the Bureau of Labor Statistics (BLS). On an annual basis, producer prices accelerated to 6.5%, the largest 12-month increase since November 2022. The figures highlight an important distinction: monthly price growth moderated, but annual wholesale inflation continued to intensify. Reuters | BLS October PPI Release


September's monthly PPI increase was revised upward to 1.4%, making October's moderation particularly notable. The annual rate, meanwhile, increased from September's 6.3%. A lower monthly reading therefore should not be confused with falling producer prices or a sustained return to price stability. 

What Does the Official Report Say?

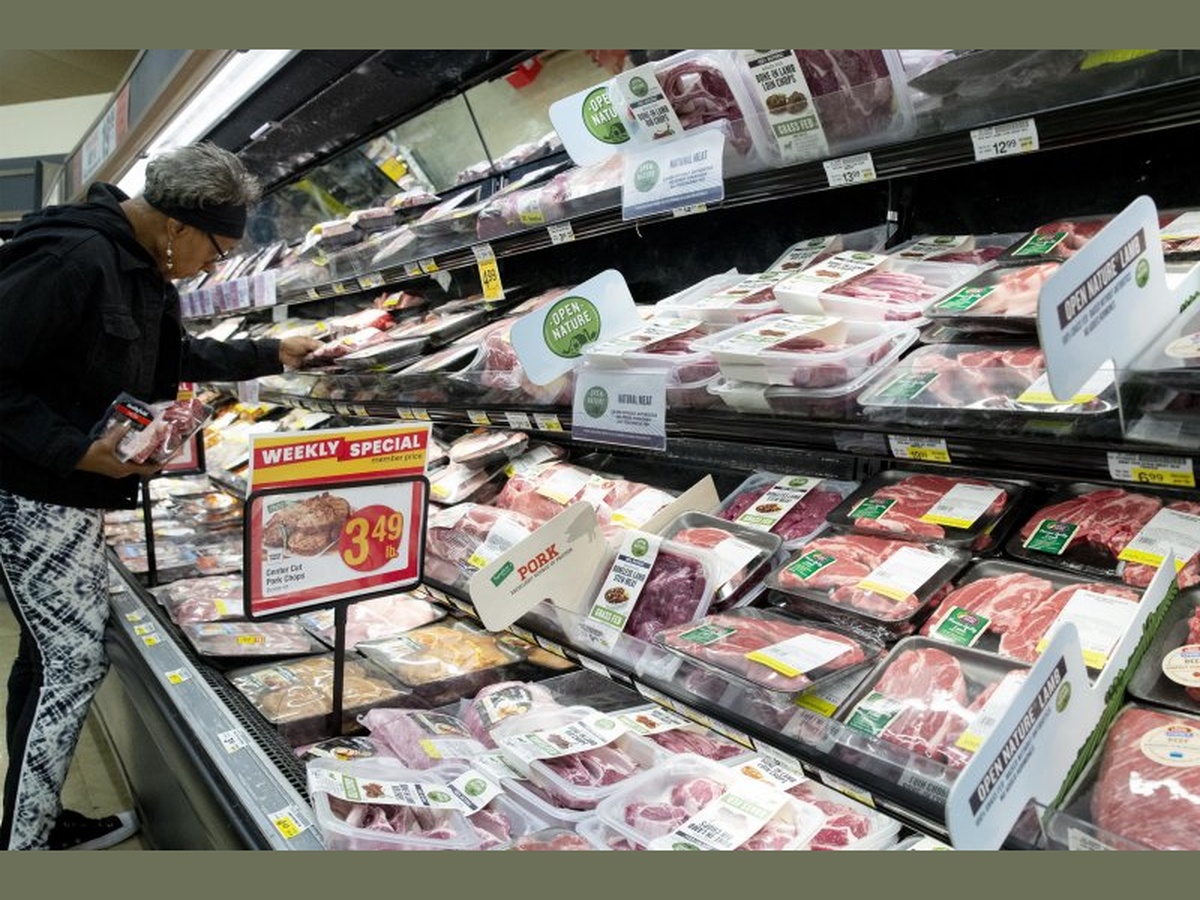
The BLS reported that final-demand goods prices rose 0.5% in October, while services prices increased 0.2%. Food prices advanced 1.3%, even as energy prices edged down 0.1% and diesel fuel prices fell 7.9%. Over the previous 12 months, final-demand goods prices increased 10.2%, indicating that goods producers were experiencing considerably stronger annual price growth than the overall index.

The gap between these figures is significant. Final-demand goods prices increased 10.2% over the 12 months ended in October, compared with a 6.5% rise in the overall final-demand Producer Price Index. This represents a 3.7 percentage-point difference, showing that goods prices were rising considerably faster than the broader producer-price measure. For manufacturers and retailers, this divergence highlights the uneven distribution of cost pressures across the supply chain. BLS October PPI Release

Another important measure—final demand excluding food, energy and trade services—rose 0.5% in October and 4.9% annually. Because this measure removes several volatile categories, it provides an additional perspective on underlying price pressure. Its continued monthly increase suggests that the softer headline number did not reflect uniform disinflation throughout the production economy.
Why Truck Freight Became the Inflation Story

Transportation was one of October's most consequential inflation drivers. Truck freight prices increased 3.9%, accounting for more than 80% of the monthly rise in the final-demand services index. Transportation and warehousing services as a broader category increased 2.0%.

This matters because freight is not simply another business expense. It connects manufacturers, distributors, wholesalers and retailers. Higher shipping charges can squeeze profit margins when businesses cannot raise selling prices, or contribute to future consumer inflation when businesses pass additional costs through to customers.

The contrast between a 7.9% monthly decline in diesel prices and a 3.9% increase in truck freight prices is especially revealing. Freight pricing depends on more than fuel alone: shipping capacity, labor expenses, contractual arrangements and demand conditions can also matter. The October figures demonstrate that lower diesel prices did not automatically translate into cheaper trucking services during the month.
Associated Press

Why Does It Matter for Businesses and Consumers?

Higher producer costs can affect companies differently depending on their pricing power. A manufacturer with long-term customer contracts may have limited ability to recover rising freight and materials costs immediately. A retailer operating with thin margins could face pressure to absorb some of those expenses, while a company with strong demand may be better positioned to increase prices.

The report also showed that processed goods for intermediate demand rose 14.6% over the previous year. These are inputs used in further production, rather than finished products sold directly to consumers. Their substantial annual increase suggests that cost pressures were present at multiple stages of the supply chain.

However, higher PPI does not guarantee an equivalent rise in consumer inflation. Companies may absorb costs, improve productivity, change suppliers or adjust prices gradually. The timing and extent of any pass-through remain uncertain. BLS October PPI, Intermediate Demand Tables
Post image
What Does October PPI Mean for the Federal Reserve?

The Federal Reserve faces a challenging balance between containing inflation and supporting economic activity. Although October's monthly PPI reading was below expectations, the 6.5% annual increase and persistent underlying pressures suggest that inflation risks have not disappeared.

The Federal Open Market Committee is scheduled to meet on December 8–9, 2026. Reuters reported that financial markets were considering the possibility of either a quarter-percentage-point or half-percentage-point rate increase in December. These are market expectations, not announced Federal Reserve decisions.

The distinction between PPI and the Fed's preferred inflation measure is also important. PPI measures prices received by domestic producers, while the Personal Consumption Expenditures (PCE) price index measures prices paid for goods and services consumed by households. Certain producer-price components can inform PCE calculations, but the headline PPI rate cannot be directly substituted for PCE inflation.

Our Analysis: Slower Inflation Is Not the Same as Lower Costs

October's producer-price report contains two opposing signals. The immediate pace of inflation moderated significantly, but the annual rate remained elevated and cost pressure was evident in freight, goods and intermediate production.

Consider a hypothetical business spending $100,000 per month on truck freight. A 3.9% increase in its freight bill would add $3,900 in monthly expenses if its spending followed the index exactly and shipment volumes remained unchanged. Over 12 months, that would represent $46,800 in additional costs if the higher monthly expense persisted. This is an illustrative business calculation, not a forecast or a claim that every company experienced the same increase.

A second useful comparison is the 3.9-percentage-point difference between the 10.2% annual rise in final-demand goods prices and the 6.3% annual PPI rate reported for September. These figures measure different categories and periods, so they should not be interpreted as a direct acceleration calculation. Nevertheless, the elevated goods inflation rate underscores why examining individual supply-chain categories provides more insight than relying on the headline alone.

For investors, the critical question is whether companies can maintain profit margins as input costs rise. For policymakers, it is whether persistent producer inflation will translate into broader consumer-price pressure. For households, the impact will depend on how much of these business costs ultimately reaches retail prices.

What Is Still Unknown?

The October report does not establish how long freight-price increases will persist, how much of the additional cost businesses will pass on to customers, or whether the softer monthly PPI figure marks the beginning of sustained disinflation. It also cannot determine the Federal Reserve's December decision in isolation.

Future CPI, PCE, employment and producer-price releases will help clarify whether inflation is broadening or gradually moderating.
Tushar Shrivas

Tushar Shrivas

B.Tech CS@ Shri Balaji Institute of Technology & Management

LinkedIn Profile

I write at Metaplugs — breaking down the latest in tech, economics, and business into simple, impactful stories for everyday readers. Passionate about software testing and global finance.